
Evidence
The example report
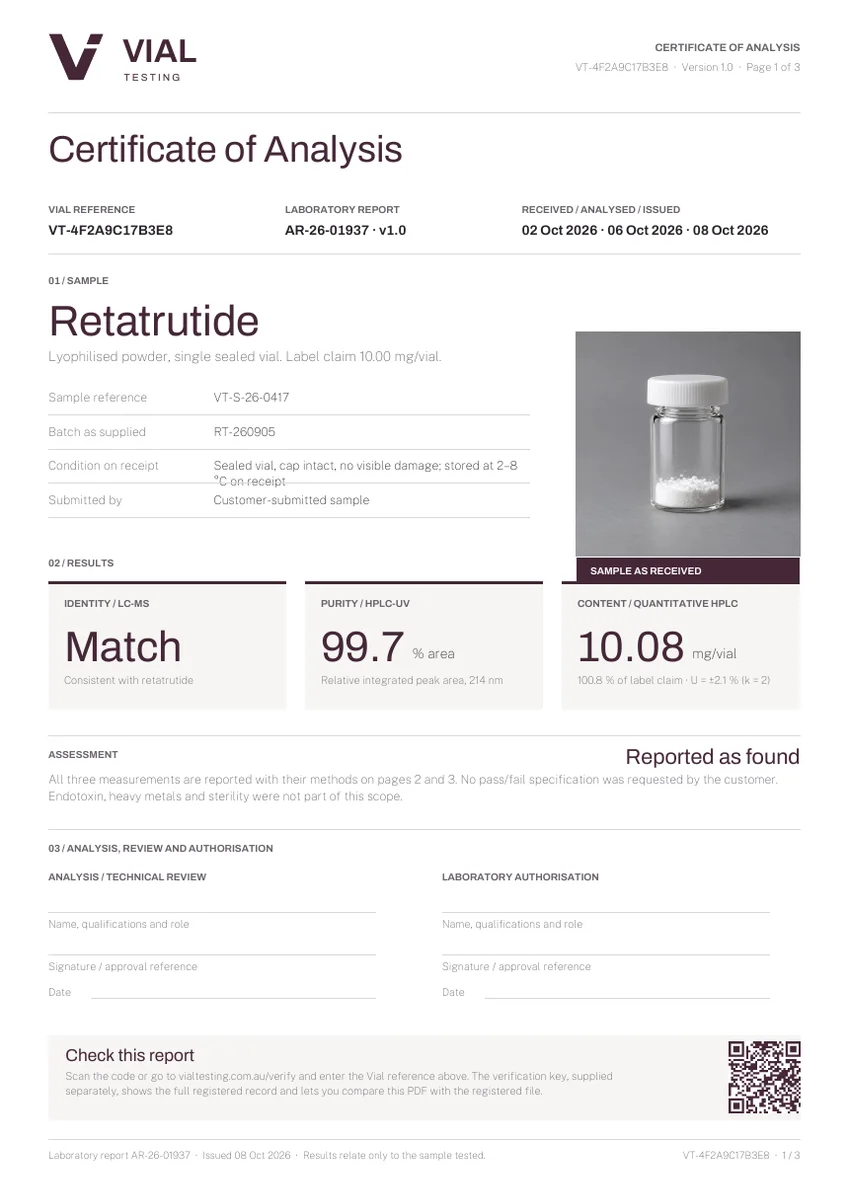
What you get back: one sample, three measurements, the supporting data, and the names of the people who did and approved the work. This example is Retatrutide, 10 mg.
Inside the report
What a good report shows
The sample, pinned down
Sample reference, batch as supplied, condition on receipt, dates and a photograph of the vial as received. The report is about this vial.
Three separate measurements
Identity, purity and content, each with its method and its basis. One number never stands in for another.
Who reviewed and approved it
Analysis and technical review are recorded separately from the laboratory’s approval of the results. Role, qualifications, approval reference, date.
The data behind the numbers
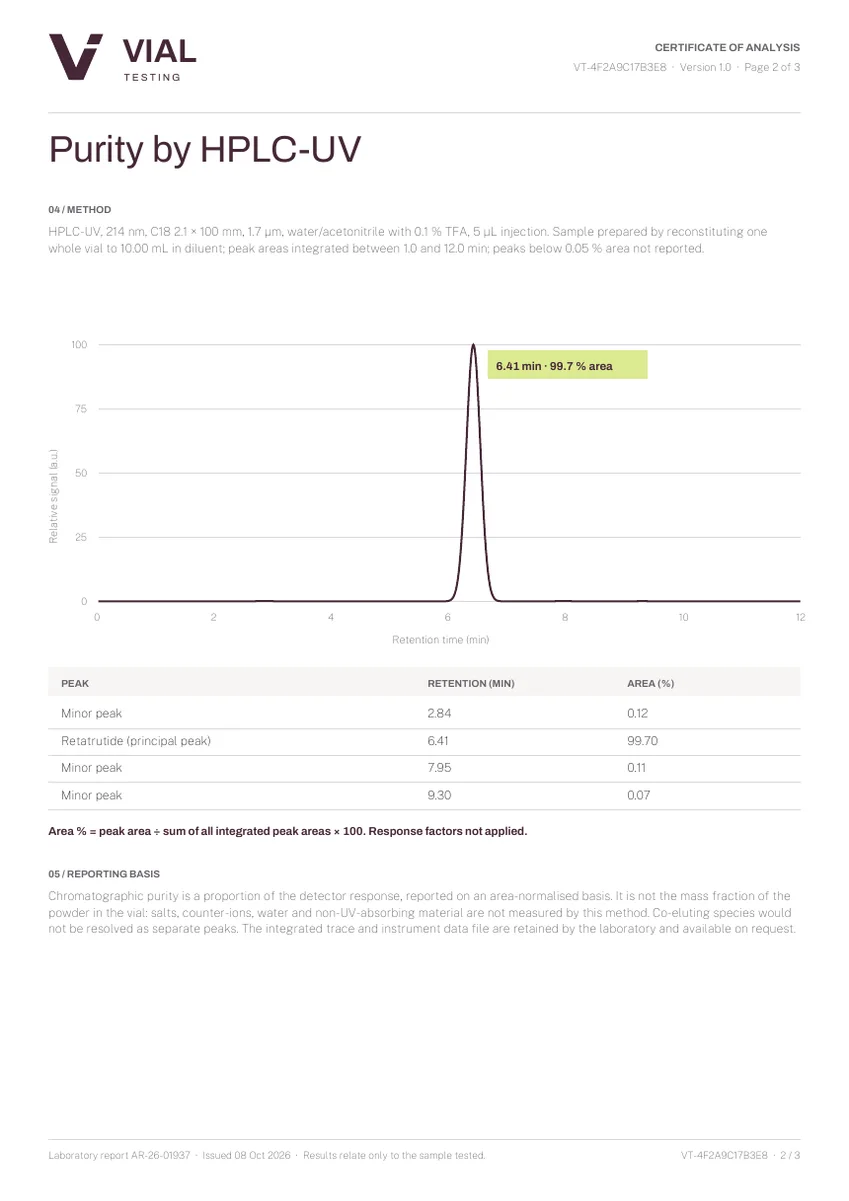
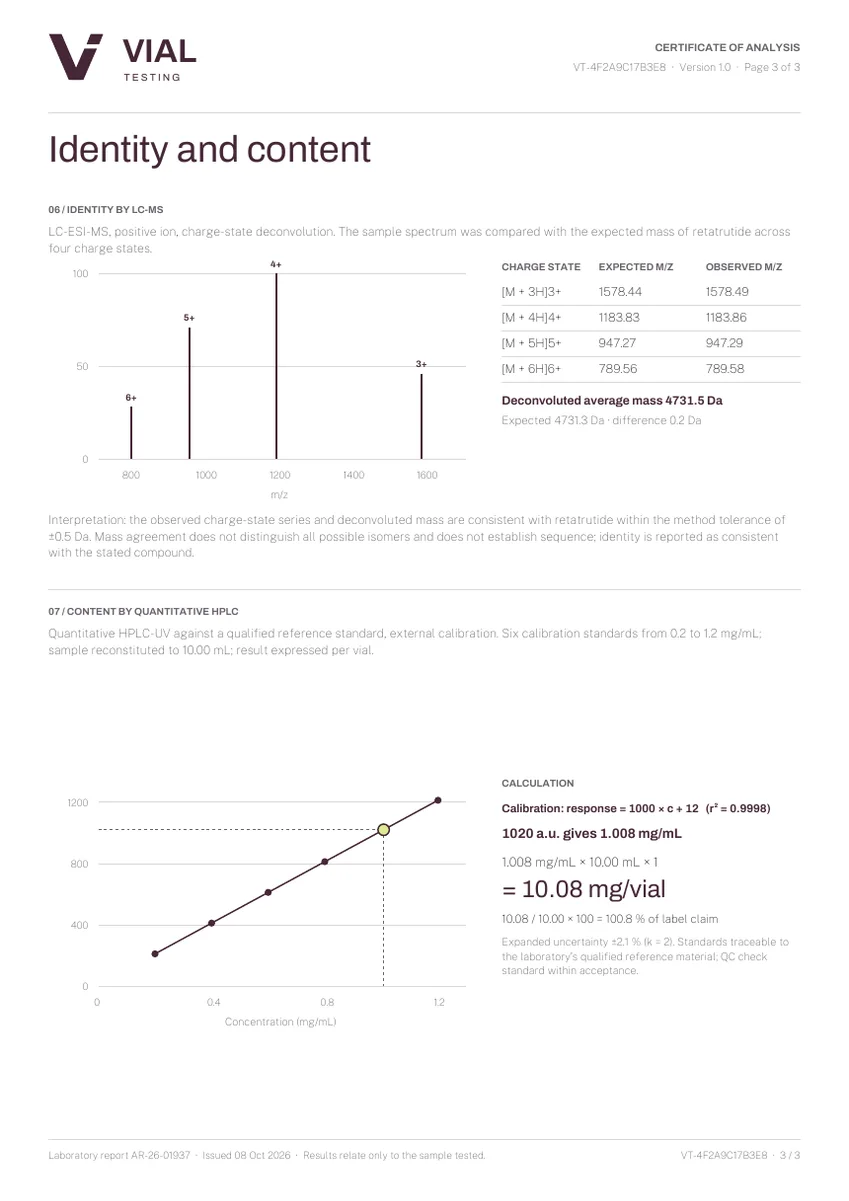
Pages 2 and 3 carry the chromatogram with its peak table, the mass spectrum with expected and observed values, and the calibration used for content.
 Vial report mark
Approval
Analysis, review and approval
The approval area separates analysis and technical review from the laboratory’s approval of the results. Each records role, qualifications, an approval reference and a date. The Vial mark identifies the report; the findings are the accredited laboratory’s, exactly as approved.
Retatrutide · 10 mg · VT-4F2A9C17B3E8
Reading the three numbers
Sample VT-S-26-0417, batch RT-260905, issued 08 Oct 2026.
The observed charge-state series deconvolutes to 4731.5 Da against an expected 4731.3 Da for retatrutide, inside the method tolerance. Mass agreement doesn’t distinguish every isomer or prove sequence, so the report says “consistent with”, not “proven”.
The share of integrated UV peak area that belongs to the main peak. It is a proportion of what the detector saw, not the percentage of the powder by mass. Salts, water and non-absorbing material aren’t in this number.
Measured against a qualified reference standard with a six-point calibration, reported with its uncertainty (±2.1 %, k = 2). Separate from purity and from total powder weight.
Endotoxin, heavy metals and sterility were not part of this scope. No pass/fail specification was requested.
Pages 2–3 · Supporting data
The data behind the numbers
Page 2 shows the chromatogram with every integrated peak, its retention time and area share, and the reporting basis. Page 3 shows the mass spectrum with expected and observed m/z for each charge state, the deconvoluted mass, and the calibration line and arithmetic that produce the content figure.
How to read the chromatogram
Four peaks are integrated between 1.0 and 12.0 minutes. The principal peak at 6.41 min carries 99.7 % of the total area; three minor peaks make up the rest. Peaks below 0.05 % area are not reported. The vertical axis is relative signal, not purity.
Why identity and content need different evidence
Identity comes from the mass spectrum: the charge-state pattern and deconvoluted mass compared with the expected value, within a stated tolerance. Content comes from calibrated quantitative analysis: a measured concentration, multiplied through the preparation volume, reported per vial with its uncertainty.
The findings are the laboratory’s
The accredited laboratory approves the analytical findings; Vial issues the report that carries them and keeps its own explanations separate. Every issued report is registered so the person holding it can check it is real and current.